
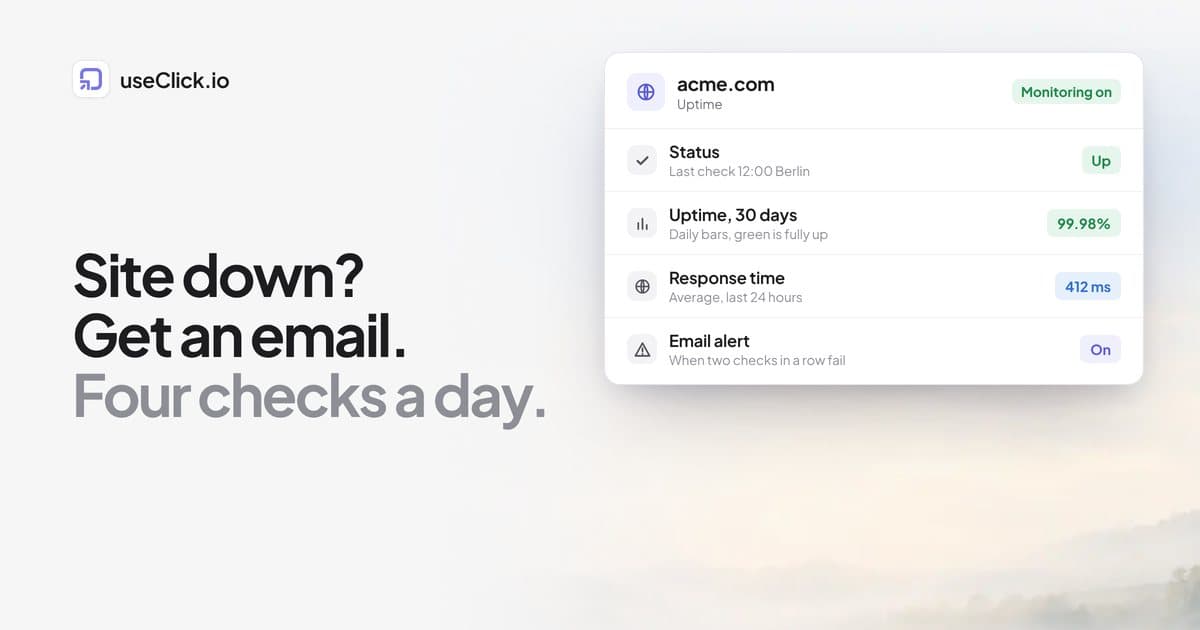
Quick answer: Add your site to useClick Website Analytics and it is monitored automatically: no extra tool, no script needed for the checks. useClick requests your site four times a day (00:00, 06:00, 12:00 and 18:00 Berlin time), retries a failed check after 15 seconds and emails you once when the site is down and once when it is back. That is basic peace-of-mind monitoring, not a minute-by-minute pager. If you need alerts within a minute of an outage, use a dedicated monitoring service.
Key Takeaways
- Monitoring starts as soon as a site is added, even before the first visit is tracked.
- A site is marked down only after a failed check and a failed retry 15 seconds later, so one slow response does not trigger an alert.
- You get one "not responding" email and one "back up" email per outage, never a stream of repeats.
- Checks run every six hours, so the outage time you see is measured between checks, not to the second.
The problem small sites actually have
Most small websites do not have an operations team. They have an owner who finds out about an outage when a customer emails, or when they happen to open the site on a Saturday. The usual causes are dull: an expired SSL certificate, a hosting plan that ran out of resources, a DNS change that went wrong, a plugin update that broke the home page.
What these have in common is that you want to know quickly, you do not want to pay for a full monitoring product to find out, and you do not want to learn yet another dashboard. That is the gap a simple built-in check fills. It will not replace serious monitoring for a shop that loses money every minute it is down. It will catch the outage that would otherwise sit unnoticed for a day.
What useClick checks and when
Every website you add to website analytics has a monitor. The schedule is the same on every plan and for every site:
| Check time (Berlin) | Runs |
|---|---|
| 00:00 | Every day |
| 06:00 | Every day |
| 12:00 | Every day |
| 18:00 | Every day |
Each check requests your site over HTTPS, records whether it answered and how fast, and follows up to five redirects. By default it checks your home page (/). You can point it at something more meaningful, such as a health endpoint or your checkout page, by changing Page to check in the Uptime card (for example /health).
When a site counts as down
False alarms are what make people switch alerts off, so the rule is deliberately conservative. When a check fails, useClick tries again 15 seconds later. Only if the second try fails too is the site marked down. A check fails when:
- the site does not answer within 10 seconds,
- the domain does not resolve, the connection is refused or the SSL handshake fails,
- the server answers with a 5xx error (500, 502, 503, 504 and so on),
- the page being checked answers with 404 or 410.
Some answers count as up on purpose: 401, 403 and 429. A login wall, a bot challenge from a CDN or rate limiting all mean your server is responding, and you do not want an email every time a firewall is doing its job.
What the alert emails say
The site owner gets two emails per outage:
- "yourdomain.com is not responding", with what went wrong (for example "HTTP 503" or "Timed out after 10 s") and when it started.
- "yourdomain.com is back up", with how long it was down.
Each outage sends one of each. Because checks run every six hours, the "back up" email arrives with the first check after your site recovers, and the outage length is measured between checks. If your site goes down at 06:10 and is fixed at 06:40, you will hear about it at the 12:00 check at the earliest, and it will not appear as a half-hour outage. Read the number as "no later than", not as a stopwatch.
You can switch the emails off per website in the Uptime card ("Email me when it goes down"), or switch monitoring off completely.
What you see in the dashboard
The Uptime card on each site's page shows the status (Up, Down with how long and why, or Checking), uptime for the last 24 hours, 7 days and 30 days, 30 daily bars (green for a fully up day, amber for 99% or more, red below that), response time over the last 24 hours with the average, and a list of recent outages with their start time, cause and duration. A down site also shows a red "Site down" chip at the top of its page and in the website list, which is handy when you manage several. The details are in the uptime monitoring guide.
Response time is the quiet benefit. A site that is "up" but slowly getting slower is a warning you will not get from an alert. A glance at the response-time line next to your traffic often explains why visitors left.
Setting it up
- In the dashboard, open Website analytics and add your site's domain (for example
example.com, withouthttps://orwww). - That is it for monitoring. The monitor is created with the site.
- Optional: install the tracking script so you also get visitors, pages and sources (setup guide). Monitoring works without it.
- Optional: change Page to check to a page that tells you more than the home page does.
- If a firewall blocks unknown clients, allow the user agent
useClick-Uptime/1.0 (+https://useclick.io/docs/uptime-monitoring). Checks are never counted as visits in your analytics.
If you run WordPress, the useClick plugin adds the site for you when you connect it.
Where basic monitoring stops
Being straightforward about this saves you trouble later.
| Need | Built-in checks | Dedicated monitoring |
|---|---|---|
| Know within a day that the site is down | Yes | Yes |
| Know within a minute | No (four checks a day) | Yes |
| Check from several countries | No | Usually |
| Check page content, not just the response | No | Often |
| Phone call or SMS alert | No (email only) | Often |
| Response time trend next to your traffic | Yes | Rarely |
If your site is how you earn money minute by minute, use both: the built-in check as a free safety net next to your analytics, and a dedicated service for fast alerts.
How long data is kept, and what each plan means
Individual checks are kept for 48 hours, hourly uptime and response time for 90 days and outages for a year. Monitoring runs for every tracked website on every plan, but on the free plan the website itself is a 14-day trial, so continuous monitoring beyond that needs Starter or above. Check the plans for how many websites each plan tracks.
Ask an AI agent
If you use the useClick MCP server with an assistant, get_website_analytics for a single domain includes an uptime block: status, uptime for 24 hours and 30 days, average response time and, while down, since when and why. "Is example.com up?" becomes a one-line question.
Frequently asked questions
How do I know if my website is down?
The most reliable way is to have something check it for you and email you. With useClick, add your domain to Website analytics and the checks start automatically, four times a day.
Is website uptime monitoring really free?
Monitoring is part of Website analytics and is included on every plan. The free plan tracks one website as a 14-day trial, so it is a way to try it, not a permanent free monitor.
How often is my site checked?
Four times a day, at 00:00, 06:00, 12:00 and 18:00 Berlin time, on every plan.
Why did I get an alert for a short outage?
A site is marked down only after a failed check and a failed retry 15 seconds later. If both failed, the site was not responding at that moment. Check the cause in the email, for example a timeout or an HTTP 503.
Why did the "back up" email arrive hours later?
Because checks run every six hours. The recovery is detected by the first check after the site responds again.
Does a 403 or a login page count as down?
No. 401, 403 and 429 count as up, because they mean your server answered.
Will the checks show up as visits in my analytics?
No. Uptime checks are never counted as visits.
Can I monitor a page other than the home page?
Yes. Change Page to check in the Uptime card to any path, such as /health.
The decision in one paragraph
A built-in uptime check will not wake you at 3 a.m., and it is not meant to. It gives every site you track a free safety net: four checks a day, a retry before it bothers you, one email when something is wrong and one when it is fixed, and a response-time chart next to your traffic. Add your domain to website analytics and you have it, and add a dedicated service on top if minutes matter.