
Short Link Management
Create branded short links and track every click.
Short Link Management →See exactly who's behind every click, then click any browser, OS, device, or language to filter your whole analytics dashboard down to that segment.
Every visitor who lands on your site arrives with a browser, an operating system, a device, and a language setting baked into their request. UseClick's Audience Breakdown card turns that into a readable, tabbed view instead of a spreadsheet of raw strings.
It sits inside your Website Analytics dashboard as one tabbed card with four views: Browser, Operating System, Device Type, and Language. Switch tabs to see a different slice of the same traffic, each row shown with its own icon so you can scan it in seconds.
This page covers how the four tabs work, what happens when you click a row to filter, how to see the full list beyond the top few items, and exactly what UseClick stores, and doesn't store, to build it.
Browser, Operating System, Device Type, and Language are each a separate tab on the same card. Every row inside a tab carries a per-item icon, so the list reads visually instead of as plain text.
See which browsers your visitors actually use, each row shown next to that browser's own logo so Chrome, Safari, Firefox, and Edge are recognizable at a glance.
Covers dozens of named browsers, not just the big four.
Break traffic down by operating system, Windows, macOS, iOS, Android, and more, each with its own logo next to the name.
Covers dozens of named operating systems.
See the split between Desktop, Mobile, and Tablet, each row marked with a device-type icon.
The three top-level device categories UseClick recognizes.
See which language your visitors' browsers are set to, from a list of 40+ tracked languages, each shown with a flag emoji next to the language name.
40+ languages tracked, each with its own flag.
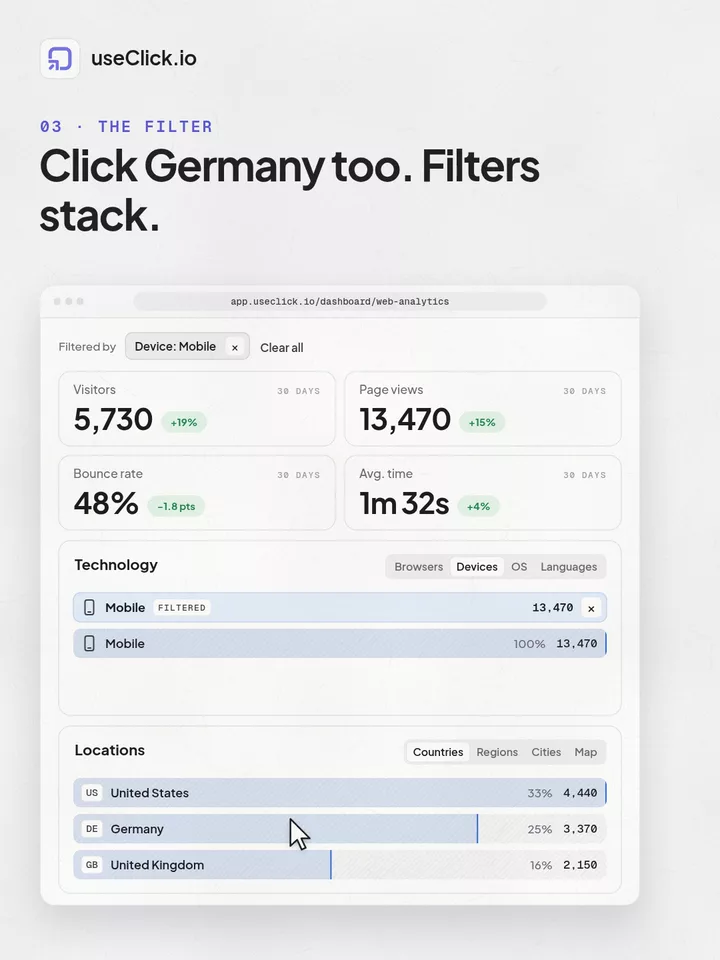
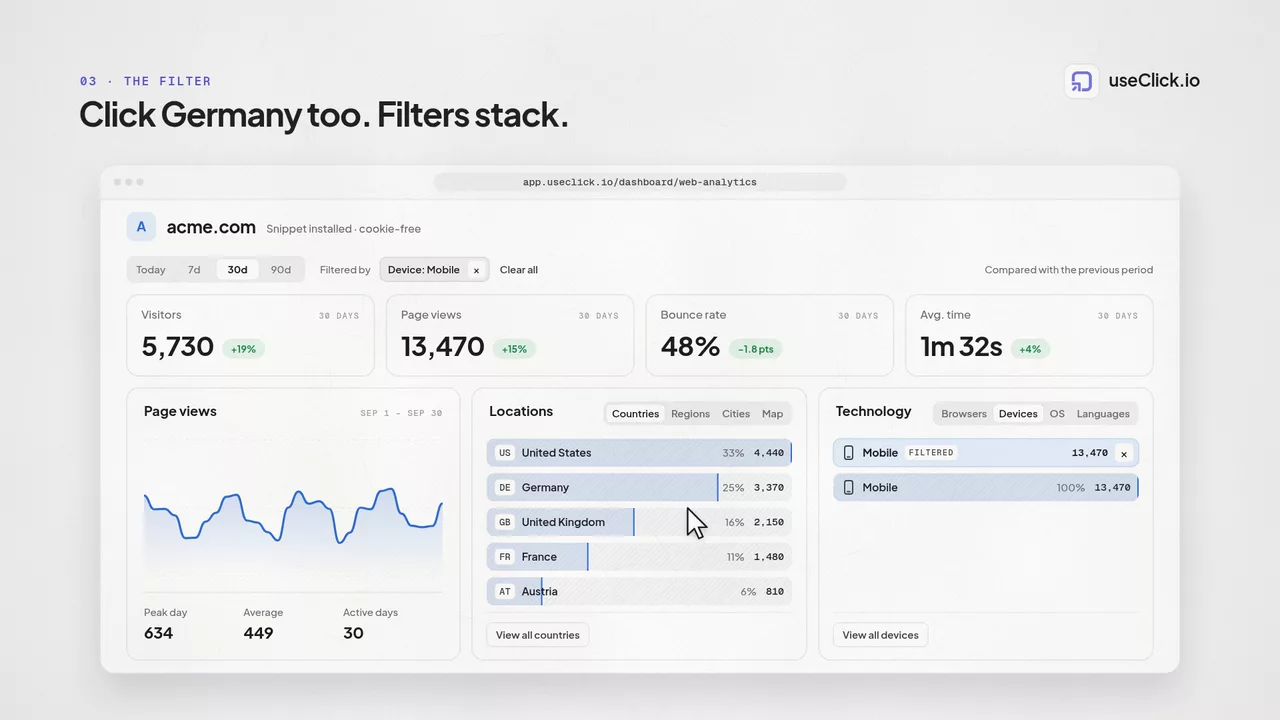
Every row in every tab is clickable. Click "Safari", "iOS", "Mobile", or any language and UseClick filters your entire Website Analytics dashboard down to visitors matching that one dimension, not just the Audience Breakdown card itself.
The time-series chart, geography, sources, and top pages all recalculate against just that browser, OS, device, or language the moment you click.
Filtering happens inline from the row you clicked. You don't have to leave the dashboard, build a segment, or run a new query to see the rest of the picture for that slice of traffic.
Each tab shows only the top handful of items inline, enough to spot your dominant browser or OS at a glance. For everything else, dozens of named browsers and operating systems, and the full list of 40+ languages, an all-data view opens with the complete breakdown.
Every visitor's browser sends a user-agent string with its request. UseClick parses that string into a small set of labels for the breakdown, then discards it, it's never written to the database.
Audience Breakdown isn't just a chart to glance at, the breakdown and the click-to-filter behavior together turn it into a working tool.
The Browser and OS tabs show your real traffic mix, so you can decide which browsers and OS versions are worth testing against instead of guessing.
If a browser or OS row looks off, click it to filter the dashboard down to just that segment and see what's actually happening for those visitors.
The Language tab breaks down 40+ languages, so you know whether translating a page is worth it before you commit the work.
The Device Type tab shows Desktop, Mobile, and Tablet side by side, so you know which experience most of your traffic actually depends on.
Audience Breakdown is one card inside UseClick's Website Analytics dashboard, sitting alongside geography, sources, and time-pattern data for the same traffic.
See how it fits into the full dashboard in our Website Analytics overview, which covers setup, core stats, and every other panel.
Audience Breakdown answers who is visiting. Where they're visiting from shows up in the same dashboard's geography section; to actively route specific countries to different destinations, that's what Geo Link Targeting does.
The same click and visit data also powers per-link reporting, see the full picture in our Analytics & Tracking feature overview.
A simple loop for turning raw visits into decisions about testing, localization, and where to focus.
Open the Browser, OS, Device, or Language tab to see how your traffic actually breaks down.
Click any row to filter the whole dashboard down to that browser, OS, device, or language.
Open the all-data view for the complete list, every browser and OS UseClick recognizes, and all 40+ languages.
Use what you see to prioritize testing, catch broken experiences, and judge whether localization is worth it.
It's a tabbed card in the Website Analytics dashboard with four tabs: Browser, Operating System, Device Type, and Language. Each row shows a per-item icon, real browser and OS logos, device-type icons, or a language flag, next to that item's share of your traffic.
Clicking any row filters your entire Website Analytics dashboard down to that segment. Every other card, the time-series chart, geography, sources, and top pages, recalculates against just that browser, OS, device, or language, with no separate report to open.
Dozens of named browsers and operating systems, and 40+ languages. Each tab shows the top items inline, with an all-data modal available for the complete list when the item you're looking for isn't in the top rows.
UseClick shows real browser and OS logos next to each Browser and Operating System row, device-type icons for Desktop, Mobile, and Tablet, and a flag emoji next to each language, so the list is scannable at a glance instead of just plain text.
No. UseClick parses each visitor's user-agent into browser, OS, device, and language values for the breakdown, then discards the raw string. The full user-agent itself, which can be used for fingerprinting, is never stored.
Yes. Analytics is included on every UseClick plan, Free through Business, so the Browser, OS, Device, and Language breakdown is available from day one, not gated behind a paid upgrade.
A shortener, a bio tool and an analytics script each see one piece of the story. useClick connects all three, so every visit comes with where it started and where it ended.
Create branded short links and track every click.
Short Link Management →One page for all your links, with per-link analytics built in.
Link in Bio →Cookie-free traffic, regions, and top pages, no consent banner.
Website Analytics →UseClick.io makes link management effortless. Create branded short links that are clean, memorable, and built to strengthen your brand identity.