
Data Export

Export Analytics to CSV

Your data belongs to you. Export click-level analytics for any link and your full link inventory as CSV files for external analysis.

You should always be able to get your own data out. UseClick gives you complete access to your data and lets you export it without lock-in.

The export system gives you granular control over what data you export, so it fits into whatever reporting and analysis process you already run.

This guide covers data exports from CSV downloads to BI-tool workflows and recurring reports.

See it in action

Data Export Interface

Export your data as CSV directly from two places in your dashboard:

Export CSV button on a link's analytics page
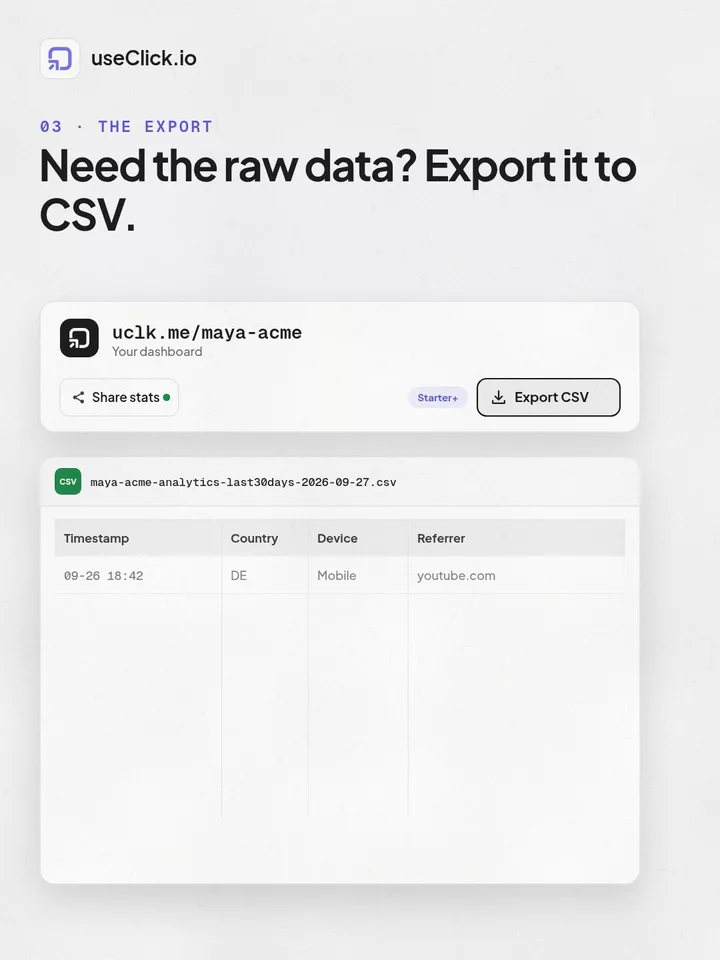
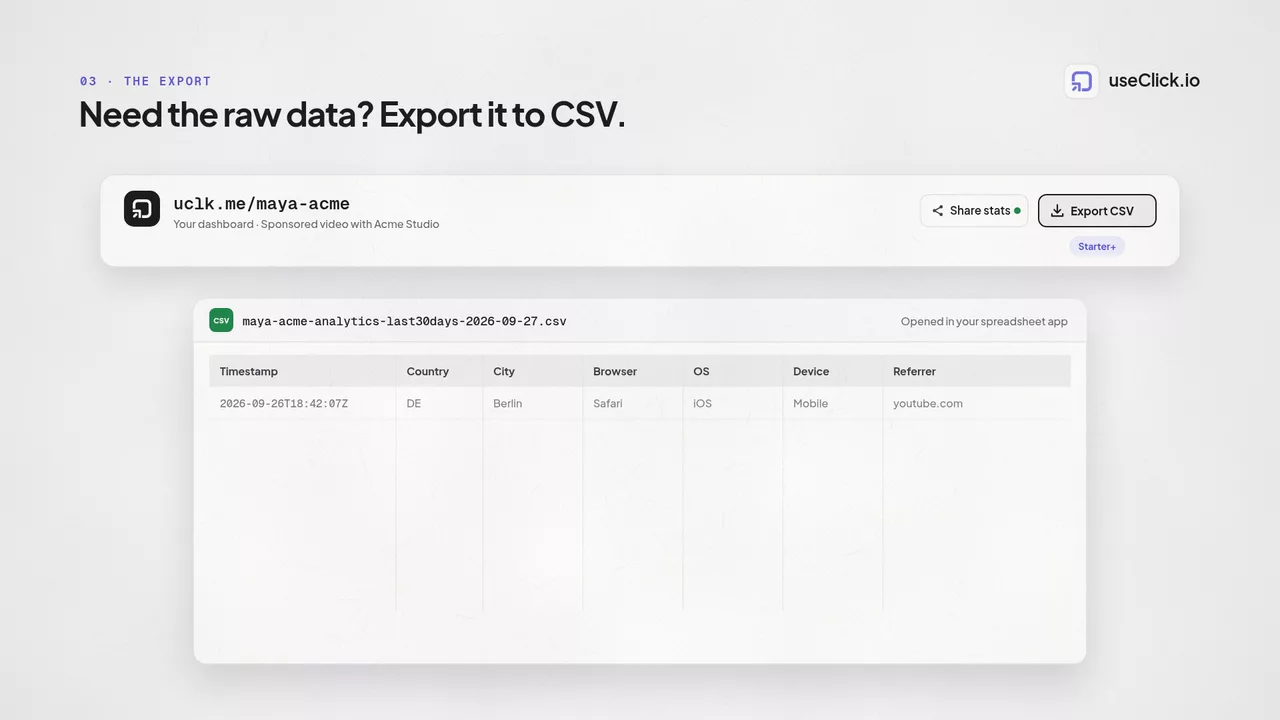
Click Export CSV on a link's analytics page to download its click data immediately, filtered by whatever date range and dimensions you've already applied.
A second, separate Export CSV button on the shortlinks list page exports your full link inventory instead.
Available Data Categories

Export Data Categories

Export the data types you need for analysis, reporting, and archiving.

Link Analytics Data

Click-level data for a single link, exported from its analytics page.
  • Timestamps and click events
  • Country, city, browser, OS, and device data
  • Referrer and source information
  • Up to 50,000 rows per export, filtered by date range, country, device, or referrer

Link Management Data

Export your full link inventory from the shortlinks list; it respects any folder, campaign, or search filters you've applied first.
  • Short links, target URLs, titles, and descriptions
  • Click totals and unique visitor counts
  • Campaign and folder assignments
  • Creation dates and last-click dates

Supported Export Formats

Choose the format that best fits your workflow and analysis requirements:

CSV (Comma-Separated Values)

Universal format compatible with spreadsheet applications:
  • Excel and Google Sheets compatible
  • Easy data manipulation and analysis
  • Lightweight and fast processing
  • Perfect for manual analysis
Compatible Analysis Workflows

Business Intelligence Integration

Use exported UseClick data in your existing analysis and reporting tools.

  • Google Analytics and Web Data

    Combine link data with website analytics for end-to-end attribution.

    • UTM campaign matching
    • Compare clicks and website sessions
    • Analyze landing page performance
    • Build cross-channel reports
  • Tableau and BI Dashboards

    Import CSV data into BI dashboards for recurring reports.

    • Create dashboard visualizations
    • Compare campaigns by date range
    • Analyze regional performance
    • Standardize management reports
  • Google Sheets and Excel

    Work quickly with raw data in spreadsheets and templates.

    • Create pivot tables
    • Fill weekly report templates
    • Combine metrics with team data
    • Build charts and shared reports
GDPR Compliance

Privacy and Compliance

UseClick's export system is built with privacy-first principles and compliance requirements in mind:

  • Data Minimization

    Export only the data you need with granular filtering options.Filter a link's click export by date range, country, device, or referrer, or filter your links list by campaign or folder before exporting.

  • Right to Data Portability

    Complete data export rights as required by GDPR Article 20.Export your data in machine-readable formats for transfer to other services.

  • Secure Data Handling

    Encrypted data transmission and browser-only file generation.Exports are built from an authenticated request and downloaded straight to your device in the browser. No separate download server stores a copy.

Data Analysis Use Cases

See how teams use UseClick exports for stronger business insights:

  • Marketing Performance Analysis

    Comprehensive campaign attribution and ROI analysis:

    Campaign Comparison
    Compare performance across marketing channels
    Seasonal Trends
    Identify peak performance periods and optimize timing
    Geographic Insights
    Understand regional performance variations
    Content Performance
    Analyze which content types drive engagement
  • Executive Reporting

    High-level insights for strategic decision making:

    Monthly Summaries
    Aggregate performance metrics and trends
    Goal Tracking
    Monitor progress against marketing objectives
    Budget Allocation
    Make data-driven budget distribution decisions
    Benchmarking
    Compare performance against industry standards
  • Customer Journey Analysis

    Understand user behavior and engagement patterns:

    Touchpoint Analysis
    Track customer interactions across channels
    Conversion Paths
    Identify successful customer journey patterns
    Engagement Timing
    Optimize content delivery schedules
    Device Preferences
    Understand how users prefer to interact

Reporting Export Close-Ups

CSV exports for teams that build their own weekly, monthly, and quarterly reports.

  • CSV for Link Click Data

    Download click events with country, city, browser, OS, device, and referrer detail in spreadsheet-ready format.

  • Custom Date Ranges and Filters

    Match exports to internal reporting windows with custom day ranges, plus filters for country, device, and referrer.

  • Raw, Timestamped Click Data

    Every row includes an exact timestamp, so you can build your own hour, weekday, or month pivot tables in Excel or Sheets.

  • Historical Analysis

    Exports respect your plan's data retention window (30 days on Free, up to 3 years on Pro and Business) and return up to 50,000 rows per request.

Data Export Best Practices

  • Regular Data Backups

    Maintain reliable data archives for business continuity:

    • Schedule weekly exports for ongoing campaigns
    • Create monthly archives for long-term storage
    • Export complete datasets before major changes
    • Maintain multiple backup locations for redundancy
  • Data Quality Verification

    Ensure export accuracy and completeness:

    • Verify date ranges match your requirements
    • Check for missing campaigns or time gaps
    • Validate metric calculations against dashboard
    • Test imports in target analysis tools

    For organizing your data before export, use campaign management to group related links and make exports more structured.

  • Efficient Analysis Workflows

    Optimize your data analysis processes:

    • Create standardized analysis templates
    • Automate common calculations and visualizations
    • Establish consistent naming conventions
    • Document analysis methodologies for team consistency
    • For managing large numbers of links, consider using our bulk upload feature to efficiently organize your link portfolio.

    Enhance your exported data with UTM parameters for more detailed campaign attribution in your analysis.

FAQ

Frequently Asked Questions

UseClick.io supports CSV export for analytics and reporting, making it easy to analyze results in Excel, Google Sheets, or BI tools while keeping privacy-focused data handling.

Yes. Export CSV reports from UseClick.io and share click-level data or your full link inventory with agencies and stakeholders.

Why all three, together

Your audience moves between links, bio and website. Now you can follow them.

A shortener, a bio tool and an analytics script each see one piece of the story. useClick connects all three, so every visit comes with where it started and where it ended.

  • Know which channel really works
  • Stop stitching three tools together
  • Count everyone, skip the banner
  • Replace three subscriptions

Ready to track smarter?

UseClick.io makes link management effortless. Create branded short links that are clean, memorable, and built to strengthen your brand identity.